Learn About Fieldprint Platform Benchmarks
Where sufficient data is available, Field to Market provides state and national level Benchmark values for the eight sustainability indicators. Benchmarks are standard calculations of sustainability performance for a fixed period of time based on publicly available, statistically robust data of agricultural production systems. Benchmarks are reference points to enhance user experience with the Fieldprint Platform by providing a known value as context for Fieldprint results.
Within a Fieldprint Project, a Project Administrator may also elect to calculate a set of Project Benchmarks, which represent the average performance across fields entered into that specific Project. Fieldprint Project Benchmarks calculated with three consecutive years of data can also be used as a Baseline to assess continuous improvement over time. Individual Fieldprint Platform users may also elect to calculate their own user benchmark after several years of data entry. They may also compare their scores directly between years and across their own fields. These individual user scores and user benchmarks can also be used to assess individual continuous improvement over time.
Note that you will encounter some crops and/or specific locations where benchmarks are not available. For example, state and national benchmarks are not available for Alfalfa. While this does not impact calculation of your individual metric scores, the benchmarks are used to scale metric scores for display on the Spidergram. Therefore, the Spidergram is not available in such cases.
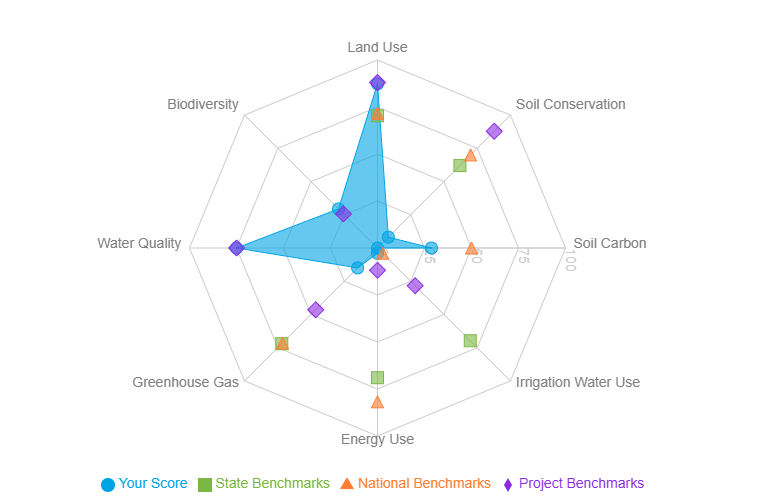
In the following example spidergram includes Project Benchmarks in addition to the State and National Benchmarks.