Ultimately, yes; however, to credibly communicate the environmental impacts of agronomic changes, Field to Market has established protocols regarding the use of results from the Fieldprint Platform. These protocols include requiring organizations to join Field to Market and registering a Fieldprint Project.
Frequently Asked Questions
Platform Basics
What crops does the Fieldprint Platform support?
- Alfalfa
- Barley
- Corn for Grain
- Corn for Silage
- Cotton
- Peanuts
- Potatoes
- Pulse Crops
- Chickpeas (garbanzos)
- Dry beans
- Dry peas
- Fava beans
- Lentils
- Lupin
- Rice
- Sorghum
- Soybeans
- Sugar Beets
- Wheat (durum, spring, winter)
Where does the Fieldprint Platform cover?
Currently, the Fieldprint Platform can produce analysis for certain crops grown in the contiguous United States.
What is the process for adding commodity crops of interest to the Fieldprint Platform?
We are constantly expanding our portfolio to meet member needs. Adding a new commodity crop involves a rigorous process to ensure your sustainability metrics are robust.
The process includes developing crop-specific data references, updating our modeling architecture, and ensuring alignment with soil carbon and soil erosion models.
- Standard Integration: For crops compatible with existing modeling frameworks, the investment typically ranges from $20,000 to $40,000.
- Complex Integration: If a crop requires custom modeling or primary research with our academic partners (such as Colorado State University), costs can range from $75,000 to $150,000.
Members can fund these additions through a combination of annual dues and supplemental project funding. We also encourage multiple organizations to partner and invest jointly so as to make these Fieldprint Platform improvements more cost-effective for all interested parties.
Please contact our team to discuss the timeline and technical requirements for your specific commodity.
What does it cost to use the Fieldprint Platform?
The Fieldprint Platform is available for anyone to use, free of charge at calculator.fieldtomarket.org. The tool is also available through qualified data management partners, embedded as a value-added service to their farm management software. Some of these data partners may charge a fee to access their software.
How long does it take to complete a Fieldprint Analysis?
Entering data for the first time could take from 30 minutes to 1.5 hours per field, depending on the complexity of the farm management practices; users report that completing a crop interval for a field gets much easier with practice. The calculations themselves are typically completed within a minute or two.
Does Field to Market help with data entry in the Fieldprint Platform?
While Field to Market does not provide data entry assistance, we do support Fieldprint Project Administrators and Implementation Partners as they work with individual growers. We offer Platform training sessions for Field to Market members, provide demos of the Platform for organizations looking to join Field to Market and maintain a support website that helps walk growers through the data entry process. Please see data entry support in User Support section of this website.
Will Field to Market help me interpret the results from the tool?
Though the tool is free and publicly available, organizations must join Field to Market to access all data and project management features, and to get direct support from Field to Market staff. General information regarding why sustainability matters for each indicator and how to improve your score are generated for each Fieldprint Analysis.
What is the SAI Platform Farm Sustainability Assessment (FSA), and how does it relate to the Fieldprint Platform?
The FSA is a global sustainability assessment developed by SAI Platform and used by food and drink companies to evaluate on-farm performance across environmental, social, and economic practices. The Fieldprint® Platform has been benchmarked against the FSA and is aligned to FSA Gold Level, the highest possible rating. Growers in a Fieldprint Project that has enabled the Equivalency Module can go a step further and earn verified FSA Bronze, Silver, or Gold for their project by answering a 22-question module in addition to the Fieldprint Analysis they already complete. See SAI Platform Alignment for the full picture.
Platform Indicators and Methodology
What indicators are measured in the Fieldprint Platform?
The Platform measures the impact of farm management practices on 8 sustainability metrics: Biodiversity, Energy Use, Greenhouse Gas Emissions, Irrigation Water Use, Land Use, Soil Carbon, Soil Conservation and Water Quality. To learn more about how these metrics are calculated, please visit our Metrics Documentation.
What models are used to calculate the eight sustainability indicators?
The following models are used as the backbone for the Fieldprint Platform’s eight sustainability indicators:
- USDA’s Water Erosion Prediction Project (WEPP) and Wind Erosion Prediction System (WEPS)
- USDA’s STEP
- SWAT+
- Habitat Potential Index (HPI)
For mor information on how these models work and impact our eight sustainability indicators, please see our metrics documentation website.
Can only one or two indicators be calculated in the Fieldprint Platform?
All eight indicators are calculated simultaneously. The Platform cannot calculate one indicator separately because much of the data a user enters is used for multiple calculations. For example, to determine Greenhouse Gas Emissions, Energy Use must first be calculated. In irrigated fields, irrigation water use affects the amount of energy consumed, which then affects the amount of the greenhouse gas carbon dioxide emitted as a result.
How are GHG Emissions reported? Are sinks and sources separated in the report?
See Table 4, Fieldprint Platform v5 Sources, using this documentation webpage. The soil carbon stock changes component is a positive value (sources) when emissions are estimated, and a negative value (sinks) when the model estimates carbon sequestration. N2O emissions are not a sink; the model always estimates some N2O emissions. N2O emissions are highly influenced by applications of synthetic fertilizer and manure, and by crop residue amounts after crop harvest. N2O emissions are attributed to the crop that received the nutrient applications.
How are project, state and national benchmarks calculated?
Project benchmarks are only available to be used by Fieldprint Projects. A Project Benchmark is the average Fieldprint metric value for all fields within a specific project that share the same scope (such as crop type or irrigation). These benchmarks are more meaningful to growers because they reflect results from others in the same region and project. They are calculated as weighted averages of field-level data, which can be area weighted, or production weighted.
National and state benchmarks take publicly available data from USDA for crop production information related to inputs (nutrients, pesticides), outputs (yield), and we create a production profile based on irrigation type (irrigated, non-irrigated). We average five years of data (2008-2012, inclusive) and estimate the metrics using weighted averages at the national and state level.
Field to Market's Soil Carbon Metric uses the SWAT+ model; is this considered a Tier 3 model?
SWAT+ can simulate processes such as soil carbon dynamics, surface runoff, infiltration, evapotranspiration, groundwater flow, sediment transport, and nutrient cycling. When coupled with additional calibration and validation against observed data, it aligns with the IPCC’s definition of a Tier 3 methodology. Tier 3 models are characterized by their comprehensive approaches, disaggregation of activity data, and the use of the latest scientific knowledge to provide granular estimates of variables of interest such as greenhouse gas emissions and removals.
By the end of 2025, Fieldprint Platform V5 will incorporate the SWAT+ model, which Colorado State University will validate to simulate soil organic carbon (SOC) dynamics in the U.S. Corn Belt. This model validation effort focuses on cropping systems that include corn, soybeans, and wheat, among other crops, which collectively comprise 92% of the Field to Market’s project acres. The SWAT+ model implementation by CSU will provide a calibrated model service with localized weather, soil properties, and crop growth modules. Modeling of SOC dynamics for other crops and/or regions outside the Midwest will rely on parameters from the USDA ARS National Agroecosystems Model, built-in parameters, and parameters from the scientific literature. Model uncertainty quantification will be provided for crops and regions with sufficient data.
The model output from SWAT+ should be considered sufficient for Scope 3 reporting.
Generation of carbon credits by SWAT+ is not currently supported.
Is SWAT+ approved by the GHG Protocol?
The GHG Protocol does not have a mechanism to formally approve tools or models in the sense of a certification, recognition, or endorsement program. However, guidance from the GHG Protocol played a significant role in the development of the Fieldprint Platform Version 5. At a later date, Field to Market will release a report describing how output from SWAT+ can be used to align with GHG Protocol Land Sector and Removals Guidance. For additional context, the “Built on GHG Protocol” recognition was officially closed on August 13, 2024.
Is there a way to add soil sample data into SWAT+ within Fieldprint Calculator?
This is a planned feature. There are two short notes in the Soil Carbon documentation about this:
- We are currently assessing how to use soil samples to refine SWAT+ modeling runs. We plan to release recommendations at a later date in 2026. Learn more on the metric documentation site.
- Baseline soil carbon measurements are crucial for establishing a starting point for sequestration calculations. Project owners are responsible for conducting soil sampling for the fields enrolled in their supply chain programs. In 2026, we anticipate that soil organic matter sample data for individual fields will be able to be entered into the SWAT+ model for more accurate estimation of soil organic stock changes. Learn more on the metric documentation site.
Does SWAT+ use a counterfactual baseline and produce total SOC change on that field each year?
The Fieldprint Platform uses an inventory approach rather than an intervention approach to account for GHG emissions and soil carbon impacts. It is important to note that Fieldprint API data partners can eventually develop intervention approaches with the Fieldprint Platform by creating counterfactual scenarios.
I migrated and recalculated my project data from Fieldprint Platform Version 4 to Version 5. Why are my GHG Emission estimates in Version 5 different or higher compared to the results from Fieldprint Platform Version 4?
Fieldprint Platform Version 5 represents a significant upgrade from Version 4, with the revision of three indicators at its center: Energy Use, GHG Emissions, and Soil Carbon.
The following methodologies were revised in Version 5:
- Irrigation operations
- Field operations
- Manure transportation
- Crop transportation
- Crop drying
- CH4 emissions from flooded rice cultivation
- Non-CO2 emissions from biomass burning
- Soil N2O
The following methodologies were added in Version 5:
- CH4 flux from non-flooded soils
- CO2 from carbonate lime applications to soils
- CO2 from urea fertilizer applications
- Direct land use change
- Soil carbon stock changes
Any of the above revisions or additions could have impacted your indicator scores. From our internal preliminary analyses, the methodologies with the highest potential to impact your results include:
- Irrigation operations: Irrigation pumps powered by diesel can expect a doubling or tripling of GHG emissions associated with water pumping.
- Soil N2O: The latest method from USDA estimates higher soil N2O emissions compared to the method from Version 4.
- Soil organic carbon fluxes: This method is an addition and may result in GHG emissions or sequestrations.
- Direct land use change: If a given field experienced land use change (e.g., pine forest to row crops), a significant amount of GHG emissions are added for the next 20 years.
What is the difference between “aligned” and “equivalent” in the FSA context as it relates to the Fieldprint Platform?
SAI Platform distinguishes two benchmarking outcomes. “Aligned” means the scheme’s content matches what FSA covers, but additional verification is required before any FSA claims can be attached to a product. “Equivalent” means verification is already part of the scheme and meets FSA’s minimum requirements, so FSA claims can be attached directly. The Fieldprint® Platform itself is aligned to FSA Gold Level. Completing the Equivalency Module and going through the verification process is what moves growers from alignment to verified FSA status.
Data Entry and Field Management
What size fields are supported in the Fieldprint Platform?
The Fieldprint Platform does not have field size restrictions. However, we do want to note that the Energy Use and GHG Emission metrics might produce unexpected results when a field is under 1 hectare or 2.5 acres in size.
Does Field to Market have a document or spreadsheet showing all the data requirements for the Fieldprint Calculator?
Yes, inputs can be filtered by indicator or seen all at once here.
Once I select "Mark as Complete" during the historical crop interval screener, can I go back and make changes?
The historical crop interval screener is designed to appear only once, when a new field is created. Once completed, it cannot be triggered again. The only way to re-access the screener is to delete the field and add a new record. If you leave the field unfinished, the screener will remain accessible until it is submitted.
What should I do if I receive a non-cropland field boundary error?
A non-cropland field boundary error occurs when the Fieldprint Platform detects previous land use not classified as cropland by the USDA Cropland Data Layer, which makes soil carbon modeling challenging. Non-cropland uses include the following:
- Almonds
- Apples
- Apricots
- Aquaculture
- Avocados
- Background
- Barren
- Barren
- Blueberries
- Caneberries
- Cherries
- Christmas Trees
- Citrus
- Clouds/No Data
- Developed
- Developed/High Intensity
- Developed/Low Intensity
- Developed/Med Intensity
- Developed/Open Space
- Grapes
- Herbaceous Wetlands
- Hops
- Nectarines
- Nonag/Undefined
- Olives
- Open Water
- Oranges
- Other Tree Crops
- Peaches
- Pears
- Pecans
- Perennial Ice/Snow
- Pistachios
- Plums
- Pomegranates
- Prunes
- Walnuts
- Water
- Wetlands
- Woody Wetlands
Please contact Field to Market staff to discuss alternatives.
How does the Platform handle double cropping or relay cropping?
The platform is set up to handle these activities. The relay or double crop should be assigned its own crop interval. The crop can be spring killed via a termination operation in the chisel/plow category (look for “vegetation is killed” description when you hover over a tillage option with the mouse pointer).
Cover crops that are harvested for grain/forage should be treated as cash crops in the Platform as there is an economic gain. They can follow the same data entry process as double crops.
Does the Platform allow for interseeding?
Ideally, by interseeding before harvest (e.g. broadcasting cover crop seeds by flying over the crop), the cover crop establishes earlier and we expect more biomass over the growing season. Having earlier cover crop planting date would ideally increase carbon seq. and decrease soil erosion.
However, at this time the platform does not have the capability to do interseeding. The current solution for interseeding in the platform is to plant the cover crop the day after harvest. We hope to add in the ability for interseeding at a future date.
If the seeding rate is unknown, what planting rate should be used?
We recommend leaving the pre-fill value for seeding rates. For grain systems, the upstream impact of seeding rates is low. Impact factors for seeding inputs were estimated on a kg basis for energy use and emissions.
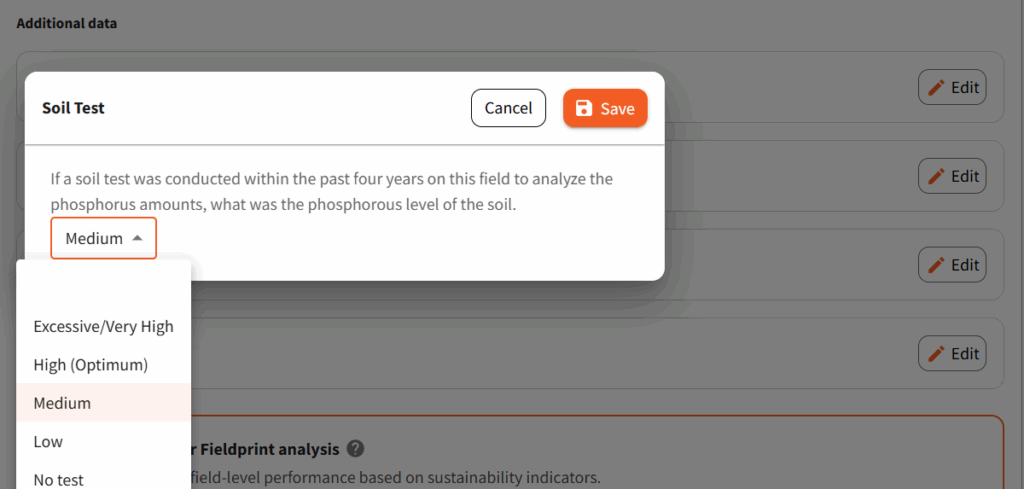
How do I determine which phosphorus level to select in the Additional Data Soil Test section? How do I account for multiple soil samples?
The soil phosphorus concentration measured in a soil test can be interpreted as a qualitative level (Low, Medium, High/ Optimum, Very High/Excessive, etc). The interpretation comes from a state’s nutrient management recommendations which are based on factors like region, crop, and soil type. The level is often included on soil test reports.
If you have more than one soil sample collected for your field, please use the dominant soil phosphorus test level for the field in the drop-down selection. For example, if a grower has 100 acres and 60 acres of the field tested low for phosphorus, please select low for the drop-down.
The section pictured below impacts the Water Quality Indicator. You can read more about the indicator on our Metrics Documentation Website.

How does the platform account for a single trip for both spraying and fertilizer applications?
As of now, the platform requires the user to enter two separate application trips for this process. We are looking into a way to indicate the activities were done in one trip. For now, we have established an alternative that does not significantly contribute to an increase in the energy use score.
Complete the fertilizer activity information needed. Add a spraying operation activity on the same date as the fertilizer application activity. Set the fuel usage for the spraying operation activity to 0.
This alternative can also be used if there is a planting pass with starter fertilizer, a tillage pass with a fertilizer application, or a cover crop planting with a fertilizer application. In these cases, the fertilizer application fuel amount would be set to 0.
How does the Platform account for manure applications and nutrients?
The manure rate and content are highly important data points to collect. You can learn more about the manure inputs on this documentation webpage.
Applications and seedings are completed with a drone. Since this is not an option in the Platform, what is the application method that should be used?
We recommend using the aerial application. The diesel usage should be updated to an equivalent value for electricity or fuel consumption of the drone. The energy use of the drone is not 0 but it’s likely much lower than the fuel consumption of an agricultural plane. For specific fuel use recommendations, please reach out via our support email.
What is the difference between "direct, low-standing stubble" and "direct, high-standing stubble" harvest options?
This distinction refers to the height of the crop remaining in the field after harvest, not the type of equipment used. For example, some growers harvest close to the ground, leaving less than 10 inches of standing stalks (low-standing stubble). Others leave taller standing stalks — sometimes over 30 inches — to provide wind protection or temporary wildlife habitat during the off-season.
How should I account for pre-burn operations like rolling straw before residue burning?
You can add a tillage operation before a residue management activity to capture practices that occur prior to burning, such as rolling straw. The platform offers two activities specifically designed for rice: Roller residue stomper and Roller residue incorporator. These can be entered as a tillage operation in the sequence before the burning activity.
Some farmers that bale or graze their cover before their main crop. Is it important to note this biomass removal?
Baling and grazing are important activities to model for soil cover and carbon dynamics. When a grower bales or grazes a cash crop or residue from the cash crop, there is economic gain and that should be reflected in how GHG emissions are allocated and captured in the Platform.
For example, if a grower harvests corn grain, then bales the residue to use or sell as animal feed or biofuel feedstock, some emissions should be allocated to the baled corn residue, which will reduce the grain emissions, since the crop produced multiple products that had value. If a cover crop results in economic gain in the form of baled forage or live grazing, then that would convert the cover crop into a cash crop, even if the original intention was to grow the crop for cover.
Is baling supported as a residue management activity in Version 5?
Baling activities are not currently supported in Version 5. There are two related challenges that have not yet been resolved:
- Crop residue as a co-product, where an allocation factor (economic, mass, or other) would lower the GHG impacts attributed to the grain.
- Baling as a harvest operation that creates crop interval definition conflicts.
For grain commodities such as rice, the platform’s crop interval structure allows for one harvest operation, with the full impact allocated to the grain. The only commodity currently supported with multiple harvest activities within the same interval is alfalfa, as it is a perennial crop. Co-product support is currently only available for cotton, where an economic allocation factor is applied between cotton lint and cottonseed.
Enhanced support for co-products, multiple harvests, and allocation factors is planned for a future release.
Can I choose different drying options for each alfalfa cutting within the crop interval?
Within a single alfalfa crop interval, different drying options can be used for each cutting, but with limitations. There are two questions to answer: Was the crop dried using energy? (If so) Where was the crop dried?
If one cutting was dried without energy, then another cutting can be dried, but only off-farm.
If one cutting was dried on-farm, then another cutting cannot be dried off-farm, and vice versa.
Can I choose different power sources for different irrigation water sources within a crop interval?
Not currently. If there are multiple irrigation water sources within a crop interval, the power source must be the same across all sources. For example, if a field was irrigated with groundwater and surface water, the power source for each must match (e.g. electricity and electricity, or diesel and diesel).
Similarly, if one source used power, the other cannot be left blank (indicating gravity-fed water).
How do the drying options in Version 5 compare to those in Version 4?
Drying operations were reviewed and streamlined in Version 5 for greater transparency and usability. The following table shows the equivalent options between versions:
| Version 4 | Version 5 |
|---|---|
| In bin combination high/low temperature and air | Combination High/Low Temp Bin |
| Commercially dried by buyer | Select “Where was the crop dried? Off-Farm” |
| Batch dryer-low temperature-no air recirculation (Continuous flow dryer) | Continuous/Mixed Flow In Bin |
| In bin-natural, air/air only | Natural Air Only |
Note that if a crop is dried by a third party not associated with the grower, the platform defaults to “Commercially Dried,” which uses a dryer profile based on available industry information. This is treated as a post-harvest impact from an LCA perspective. If the farmer has full control of the dryer system, select “Where was the crop dried? On-Farm” to view available on-farm drying options. You can read more about the drying methods in the platform documentation.
Does Version 5 support on-farm solar energy for irrigation or drying?
Version 5 does not currently include an accounting method for on-farm solar or wind energy generation. This is a known limitation described in the metric revision documentation.
The Version 4 treatment of on-farm solar energy was considered inaccurate because it assigned 0 energy use and 0 GHG emissions to operations powered by on-farm solar, such as irrigation pumps or grain dryers. A complete and accurate method would need to include upstream impact factors associated with the manufacturing of solar panels and energy storage systems — similar to how the platform currently accounts for the upstream impacts of fertilizer manufacturing.
If on-farm solar energy generation is prevalent in your project, please contact Field to Market staff so we can begin planning to address this data gap.